Lesson 1.11.1 : R-squared (R²)
R-squared (R²) in Machine Learning
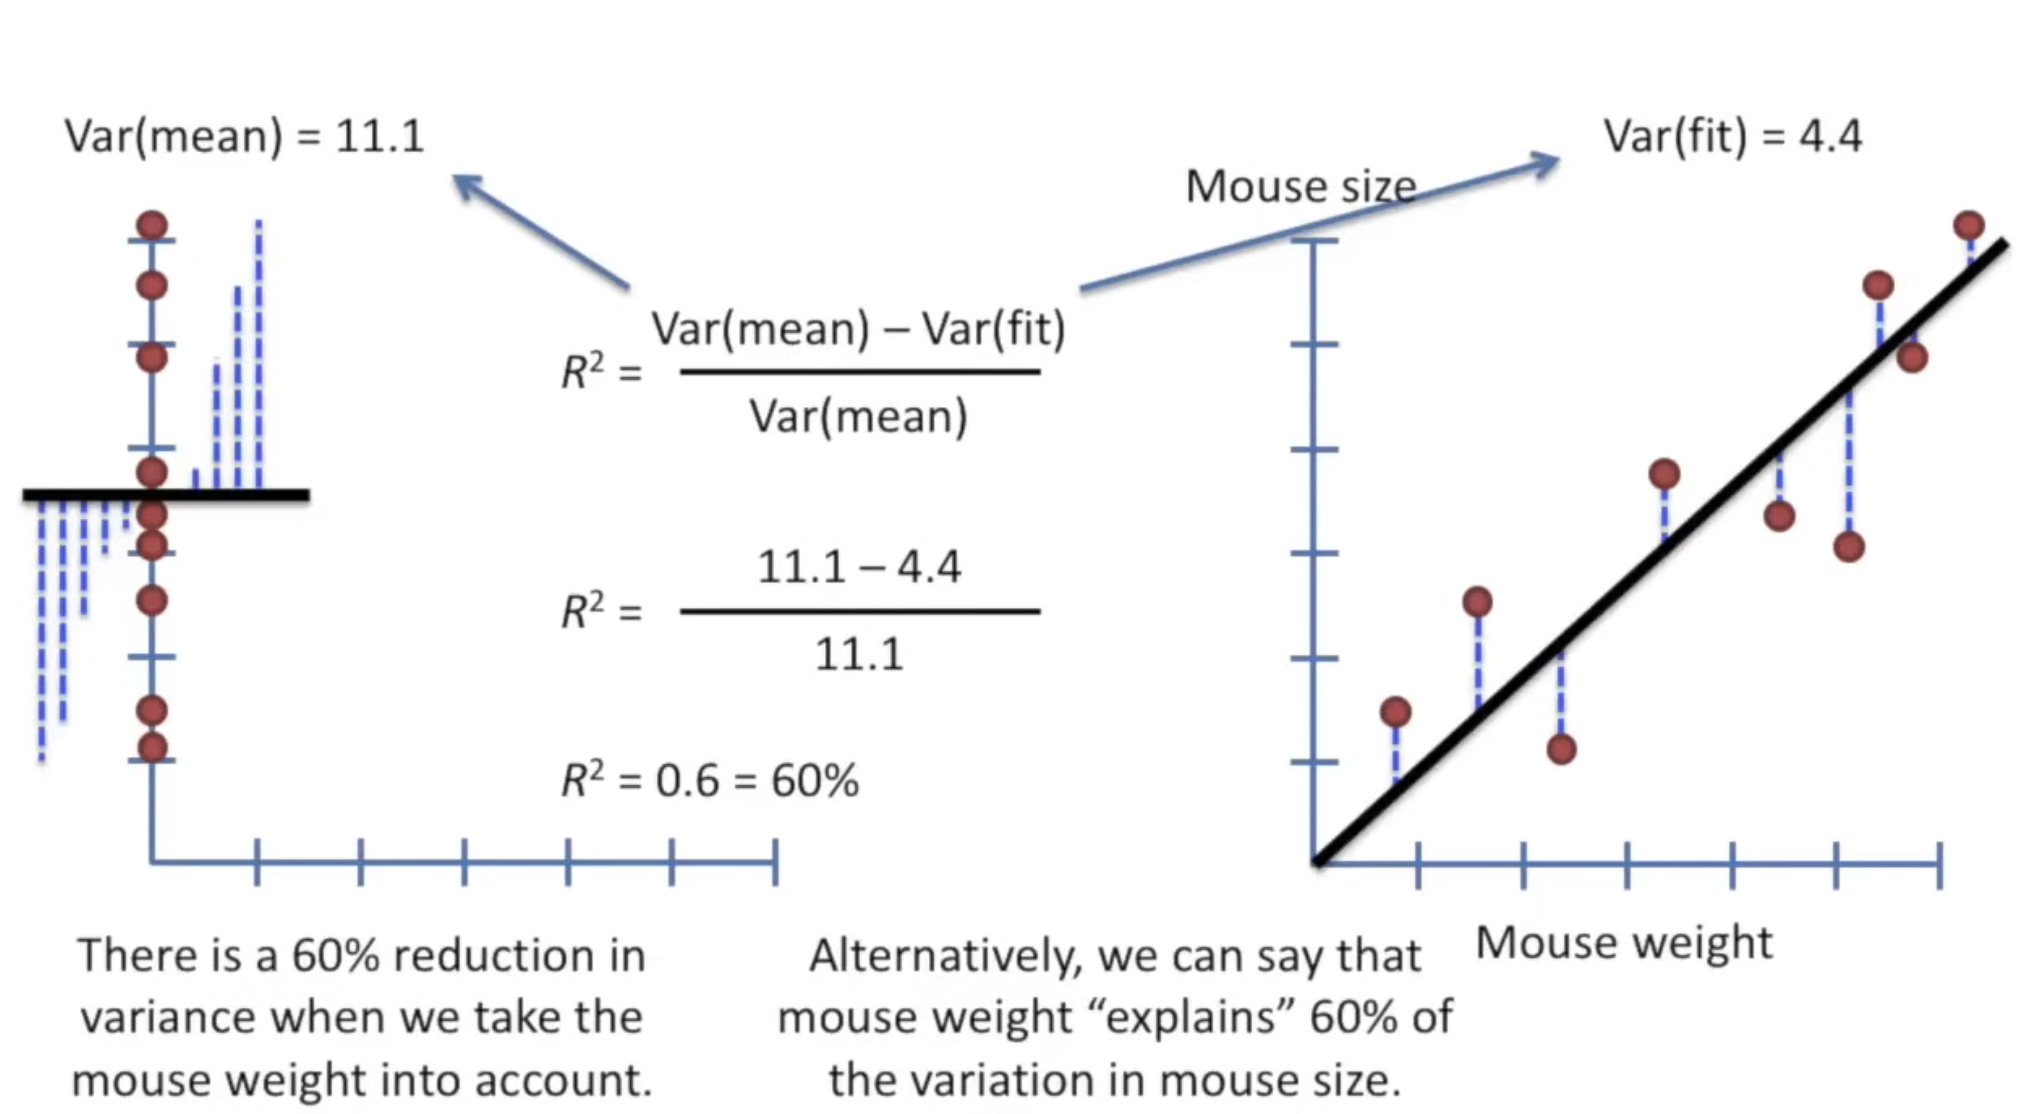
R-squared, also known as the coefficient of determination, is a statistical measure that explains how well a regression model fits the observed data. It indicates the proportion of variance in the dependent variable (target) that is predictable from the independent variables (features).
- Range: 0 to 1 (or 0% to 100%)
- Interpretation:
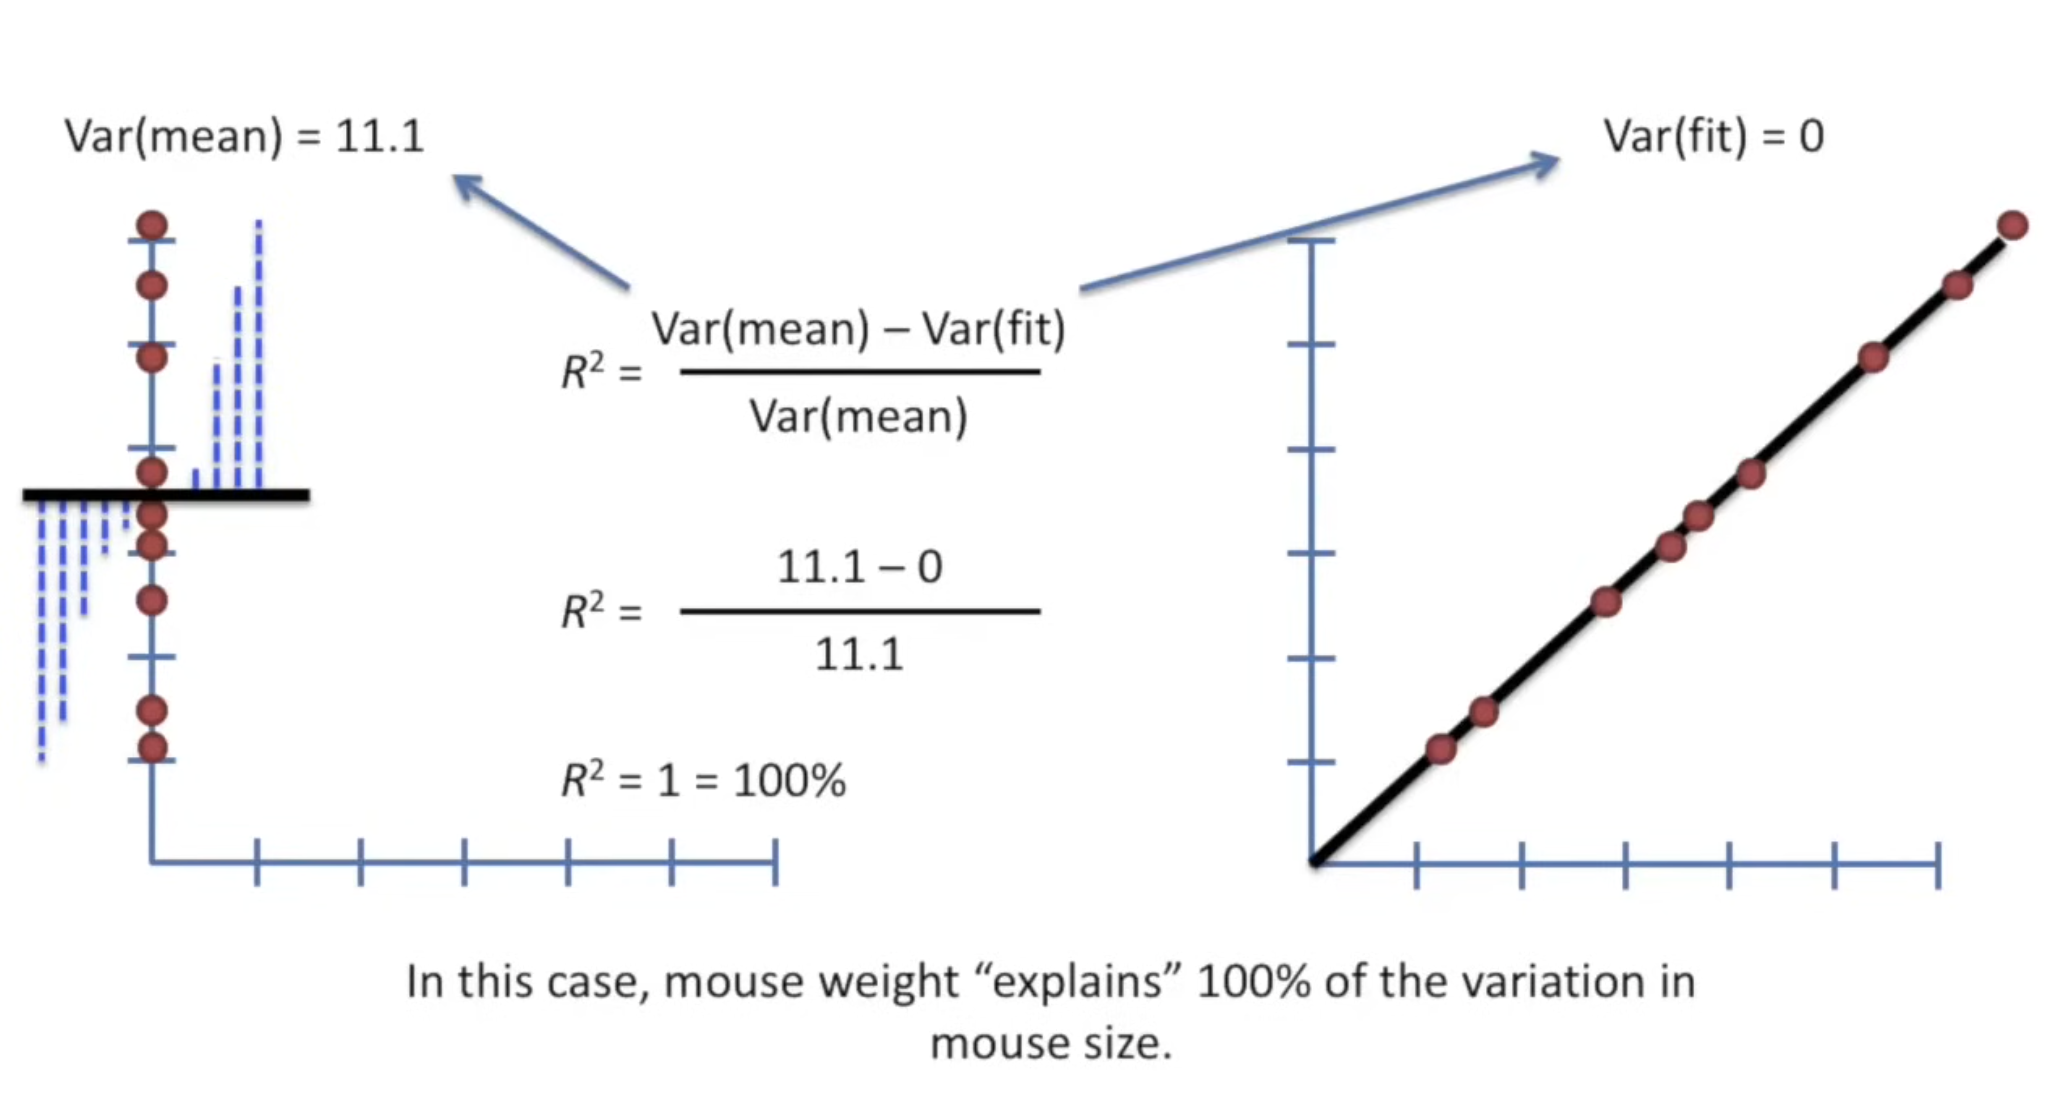
- R² = 1 → Perfect fit (all data points lie on the regression line).
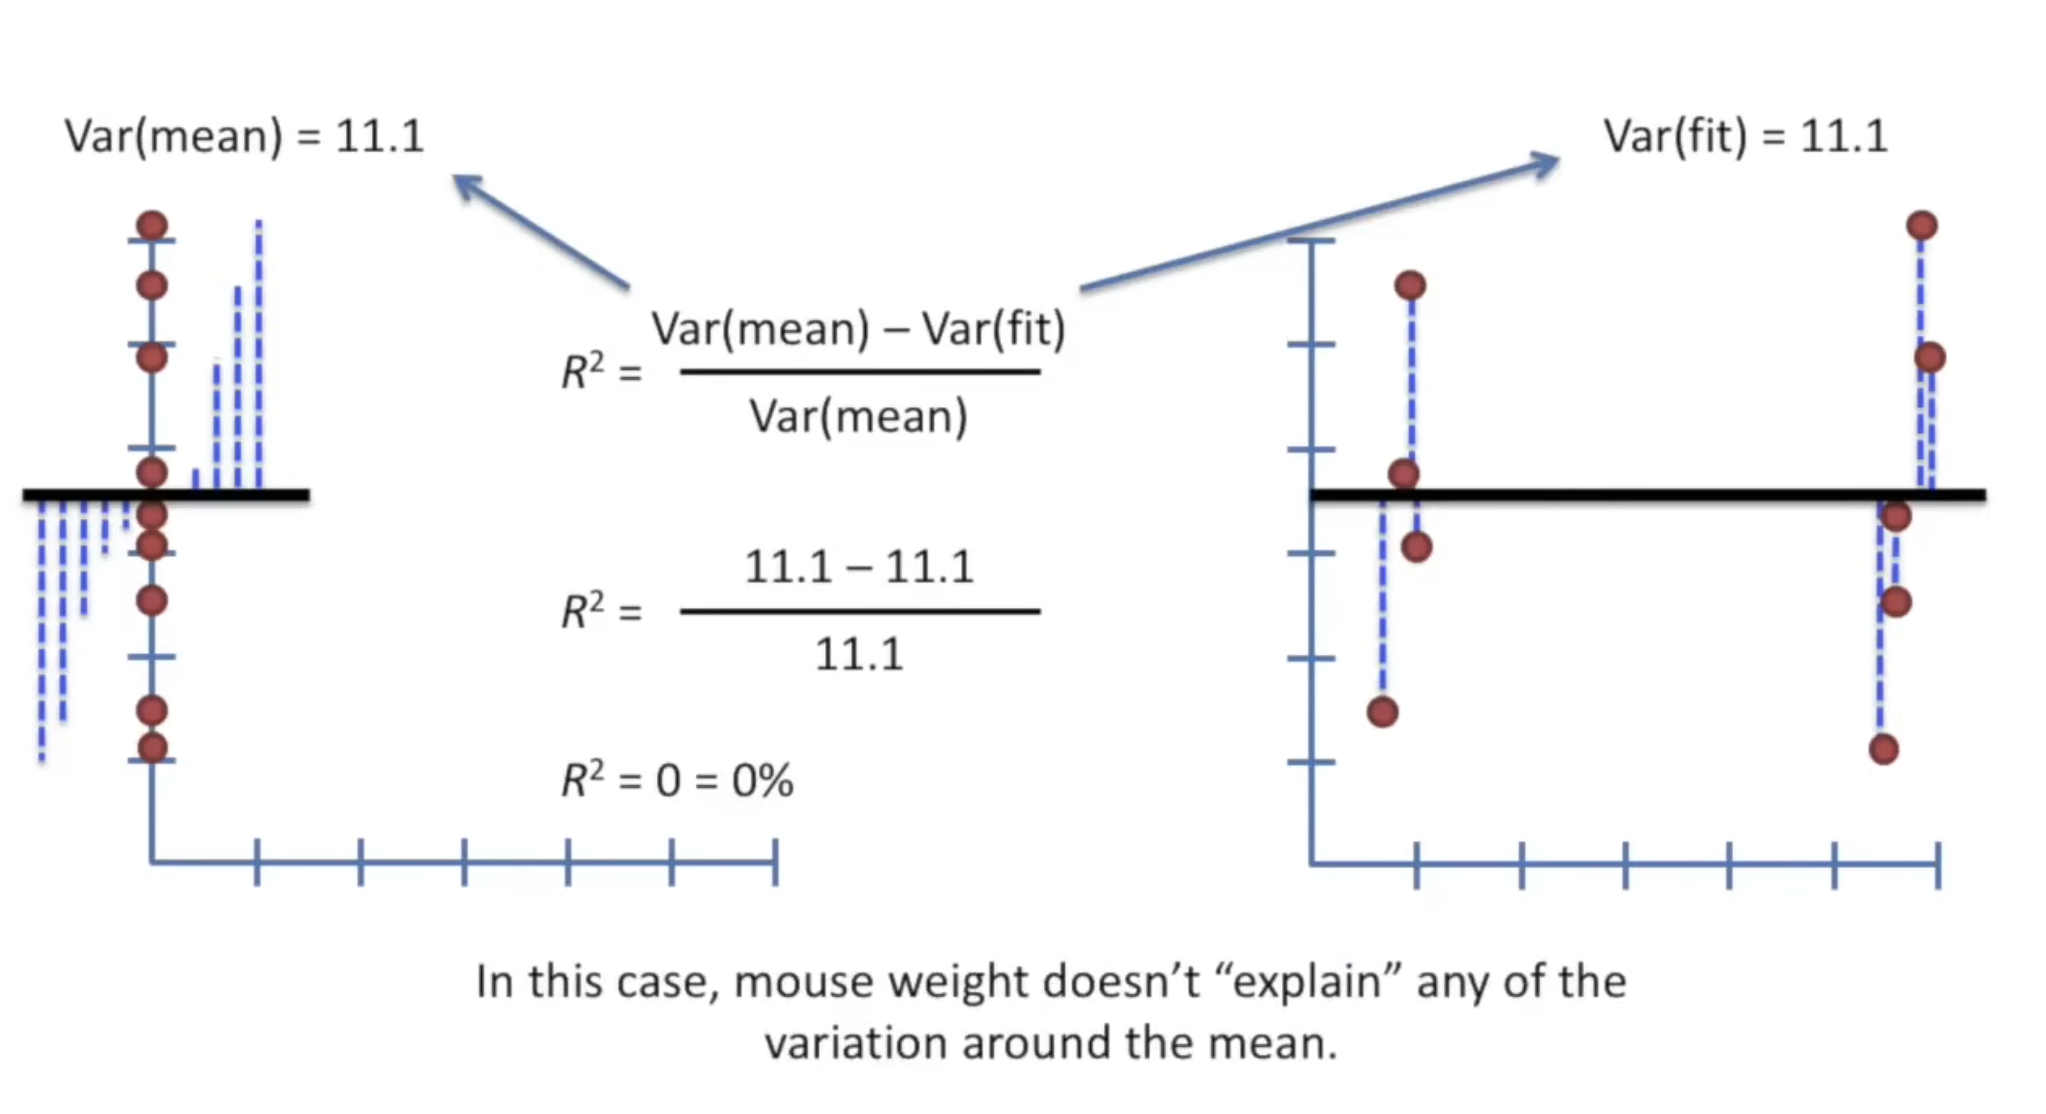
- R² = 0 → Model explains none of the variability (no better than predicting the mean).
- Negative R² → Model performs worse than a horizontal line (possible if the model is arbitrarily bad).
R-squared Formula
The coefficient of determination is defined as:
Where:
- SSres = Sum of squared residuals (errors)
- SStot = Total sum of squares (variance in the target)
Example 1: Simple Linear Regression
Data:
| (sq. ft.) | (Actual Price) | (Predicted Price) |
|---|---|---|
| 1000 | 200,000 | 210,000 |
| 1500 | 250,000 | 240,000 |
| 2000 | 300,000 | 270,000 |
| 2500 | 350,000 | 300,000 |
Calculations:
- Mean of ():
- :
- :
- :
Interpretation: The model explains 78.1% of the variance in house prices.
Example 2: Perfect Fit ()
Data:
| 1 | 2 | 2 |
| 2 | 4 | 4 |
| 3 | 6 | 6 |
Example 3: Poor Fit ()
Data:
| (Mean Prediction) | ||
|---|---|---|
| 1 | 10 | 20 |
| 2 | 20 | 20 |
| 3 | 30 | 20 |
Key Notes
- : Perfect fit.
- : Model predicts mean.
- Limitations: Use adjusted for multiple regression.
Key Takeaways:
- When someone says, "The statistically significant was 0.9...", you can think of yourself :
- Very Good! The relationship between the two variables explains 90% of the variation in data.
- When someone says, "The statistically significant was 0.01..." you can think of yourself :
- Who Cares! If that relationship is significant, it only accounts for 1% variation in the data.
- Something else must explain the remaining 99%.